
CONTEXT
After graduating college, I explored my interest in maps and the ways graphic design is used to interpret data into visual systems.
After graduating college, I explored my interest in maps and the ways graphic design is used to interpret data into visual systems.
CONCEPT
Stretch the definition of a "map" to represent complex relationships by creating intuitive data systems.
Stretch the definition of a "map" to represent complex relationships by creating intuitive data systems.
GOAL
Challenge conventional cartography by leveraging graphic design principles to reimagine how maps function across data environments.
Challenge conventional cartography by leveraging graphic design principles to reimagine how maps function across data environments.
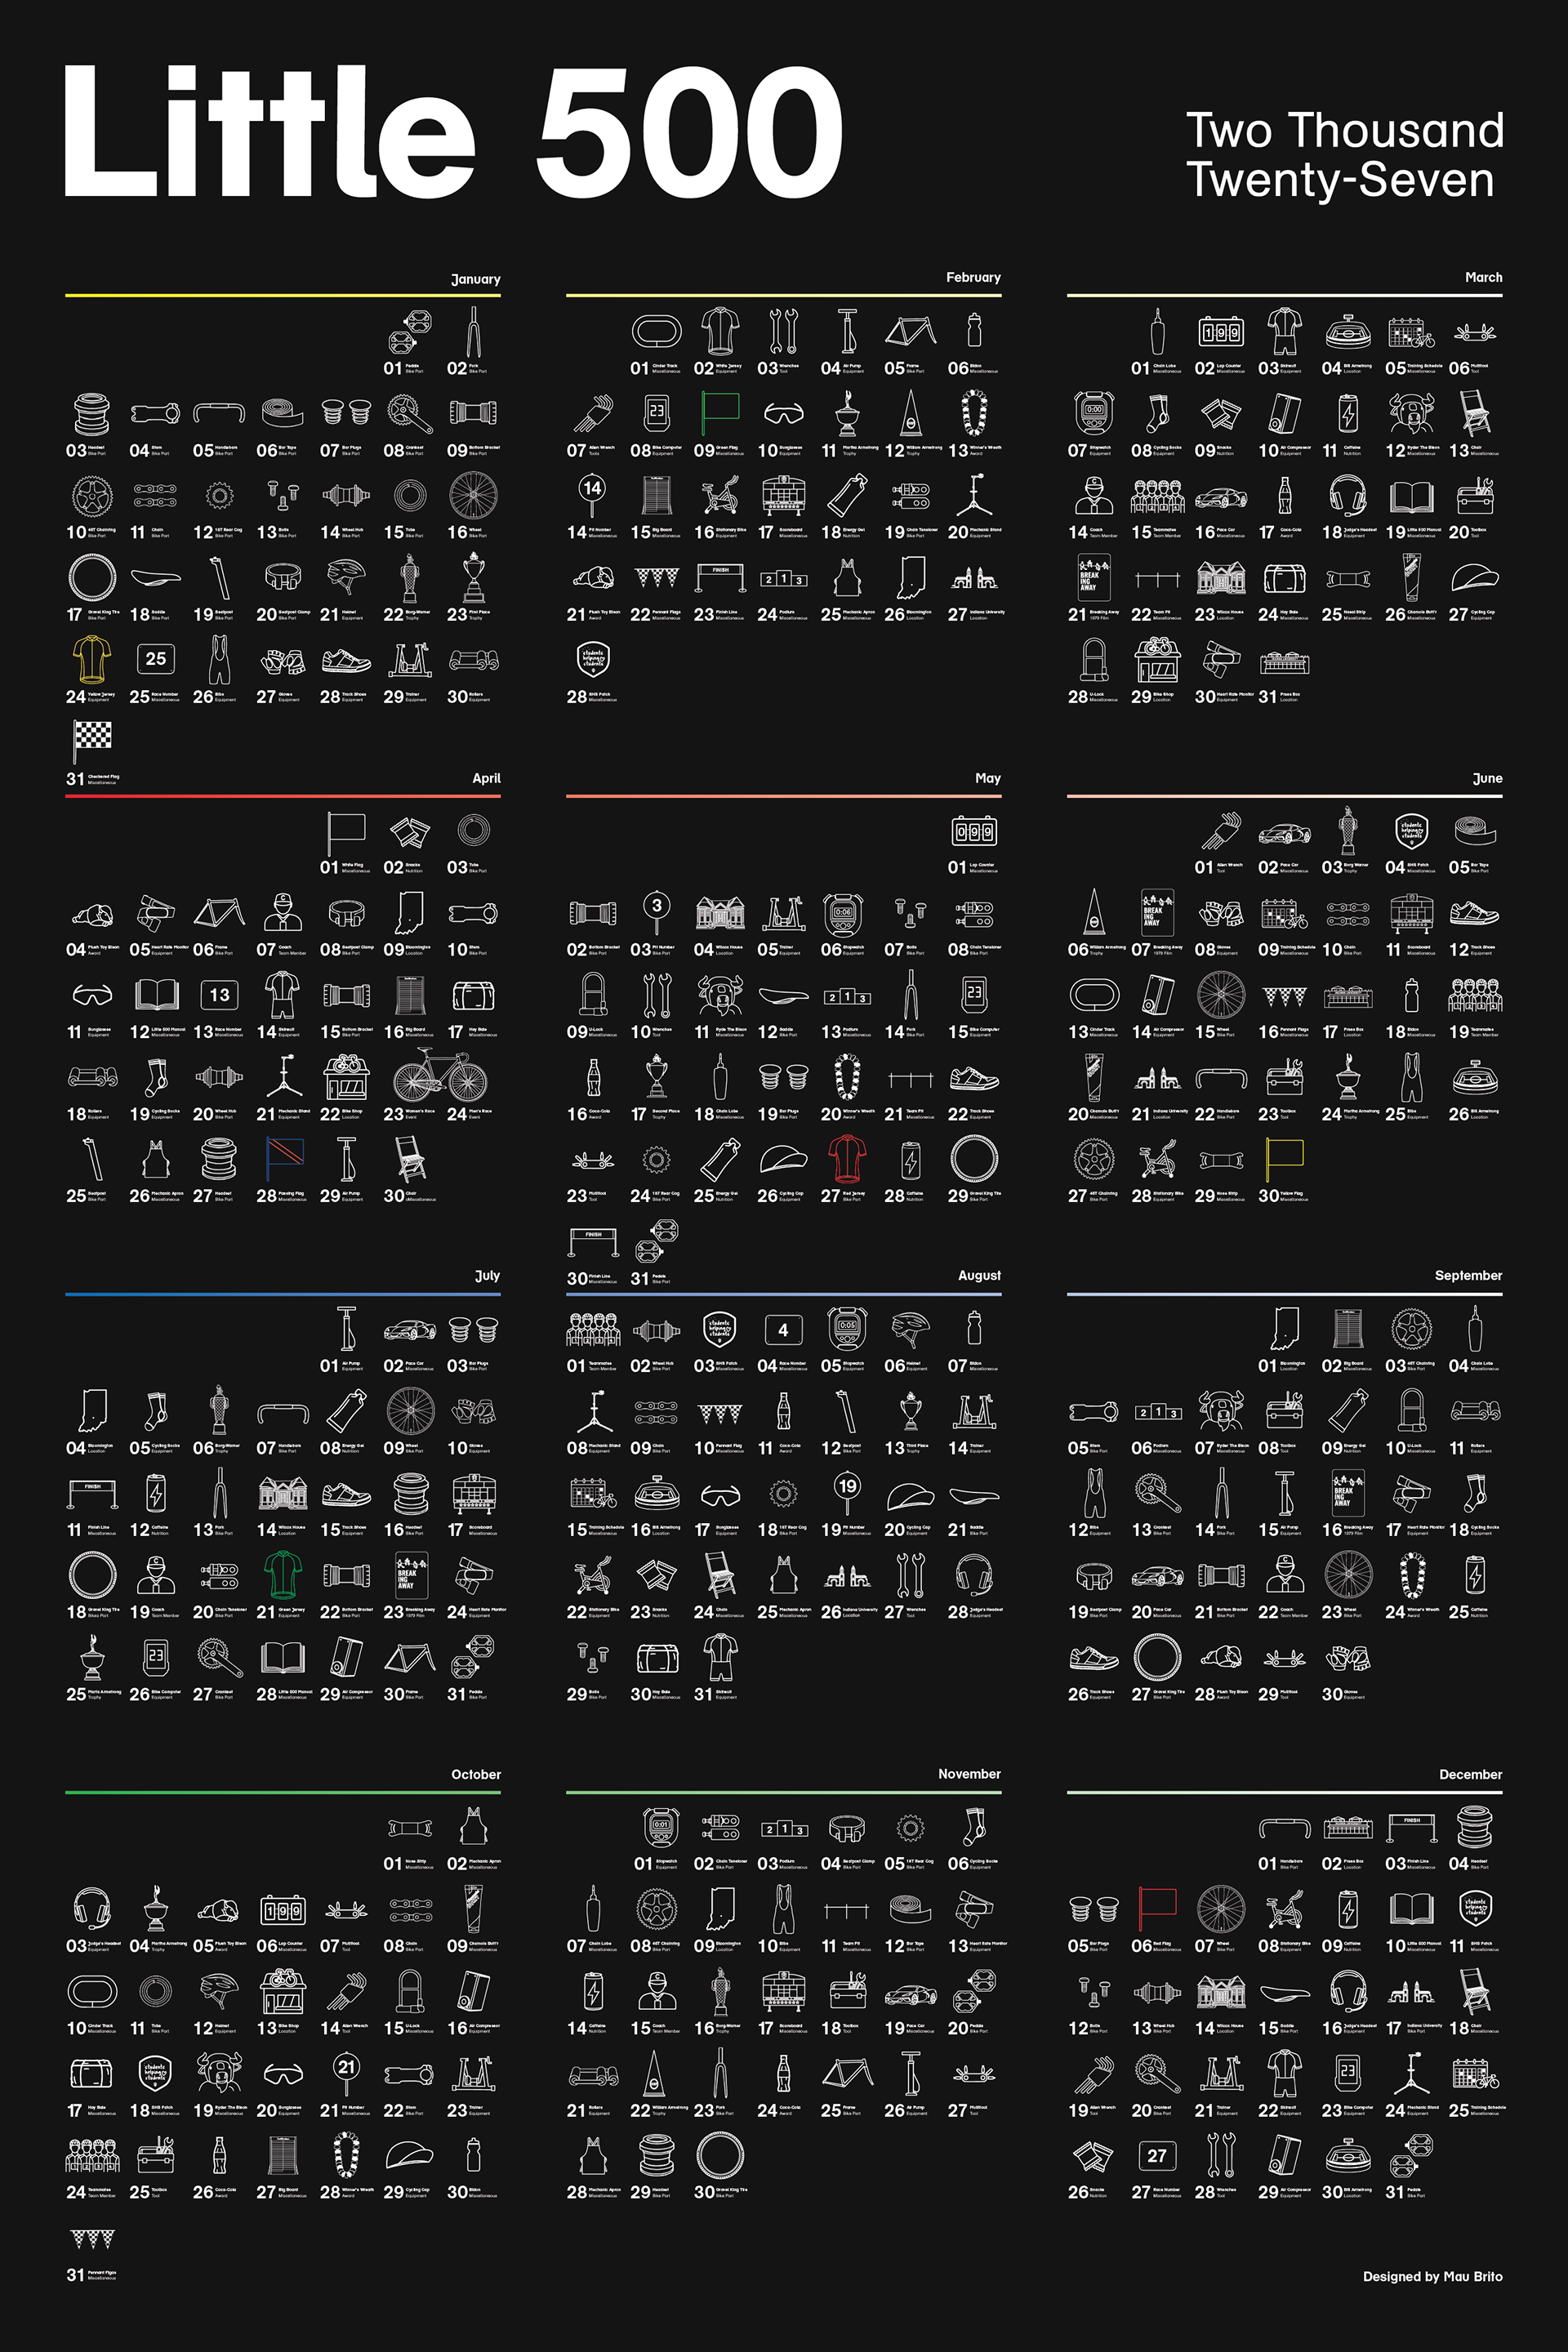


LITTLE 500 CALENDAR
While traveling between Boston, Louisville, Indianapolis, and Chicago, I jotted down 90 distinct items related to my experience racing in the Little 500. I mapped these icons across 365 days, repeating each one roughly three times. By intentionally leaving out weekday labels, the final piece loses functionality but instead shifts focus to the individual items that formed my college years.
While traveling between Boston, Louisville, Indianapolis, and Chicago, I jotted down 90 distinct items related to my experience racing in the Little 500. I mapped these icons across 365 days, repeating each one roughly three times. By intentionally leaving out weekday labels, the final piece loses functionality but instead shifts focus to the individual items that formed my college years.


75TH ANNIVERSARY LOGO
The challenge was making a commemorative mark that felt tied to the race, not just a number locked up with a logo. I turned "75" into the bicycle itself, using the angle of the 7 as the fork and the 5 as the back wheel. Layering the Little 500 colors behind it creates a sense of speed resulting in a simple mark designed to hold up across different scales.
The challenge was making a commemorative mark that felt tied to the race, not just a number locked up with a logo. I turned "75" into the bicycle itself, using the angle of the 7 as the fork and the 5 as the back wheel. Layering the Little 500 colors behind it creates a sense of speed resulting in a simple mark designed to hold up across different scales.